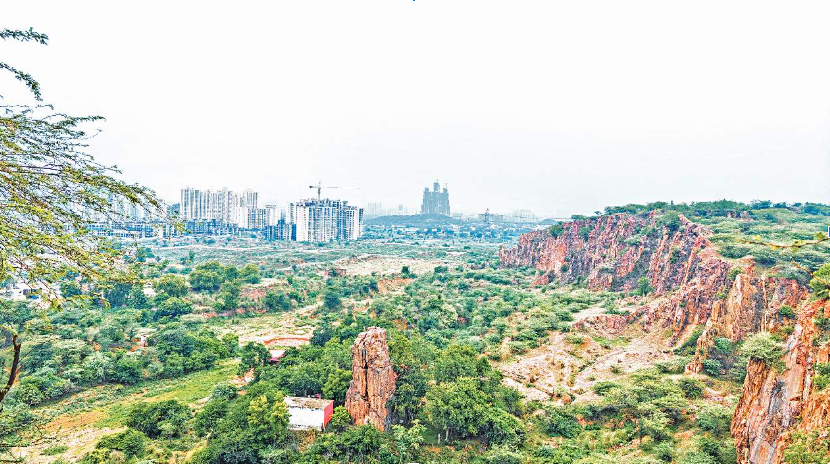
The Aravalli Range—stretching across Gujarat, Rajasthan, Haryana, and Delhi—is among the oldest
fold mountain systems on Earth. Today, it faces intense pressure from mining, urban expansion,
deforestation, invasive species, groundwater depletion, and climate stress. Traditional field-based
restoration, while essential, is no longer sufficient on its own.
Remote sensing & GIS provide a synoptic, replicable, and science-driven approach to:
Identification of the degraded areas
Prioritise restoration zones with stakeholders’ participation
Monitor recovery over time
Support evidence-based policy and compliance
The Sankala Foundation conducted a research study for the Eco-restoration of Aravalli Landscape in
four villages (Sakatpur, Shikohpur, Naurangpur, and Gairatpur Bas) of Gurugram, Haryana. The study
examines how key geospatial indicators—NDVI, LULC, Slope, DEM and Drainage Network, UHI, and NDMI—can be
operationalised for eco-restoration of the Aravalli landscape.
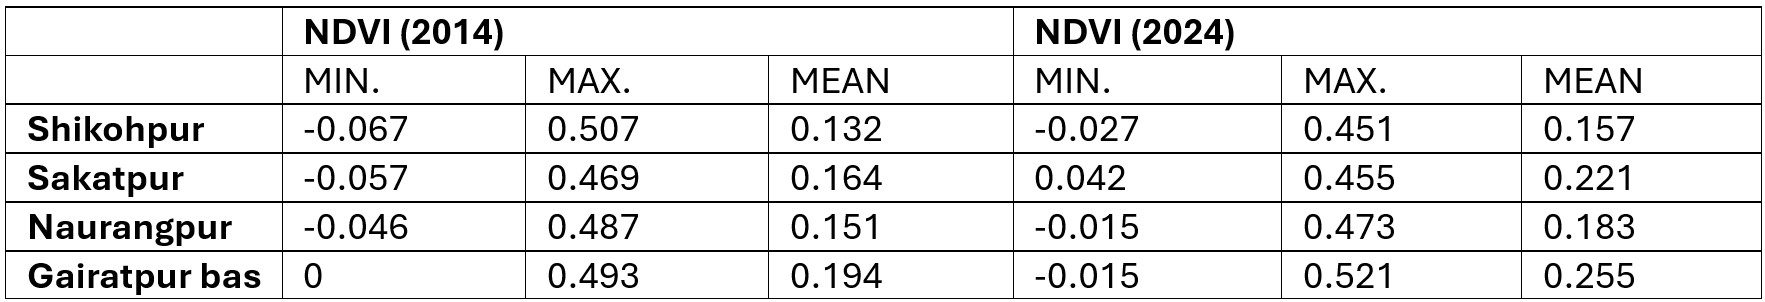
1. Normalised Difference Vegetation Index (NDVI)
The NDVI is a numerical indicator that assesses the health of vegetation using remote sensing data.
The value ranges from -1 to +1. High NDVI values (close to +1) indicate healthy, dense green
vegetation; while moderate (0.2 to 0.5) suggest sparse, low values indicate little or no vegetation and
negative values indicate water bodies or non-vegetated features.
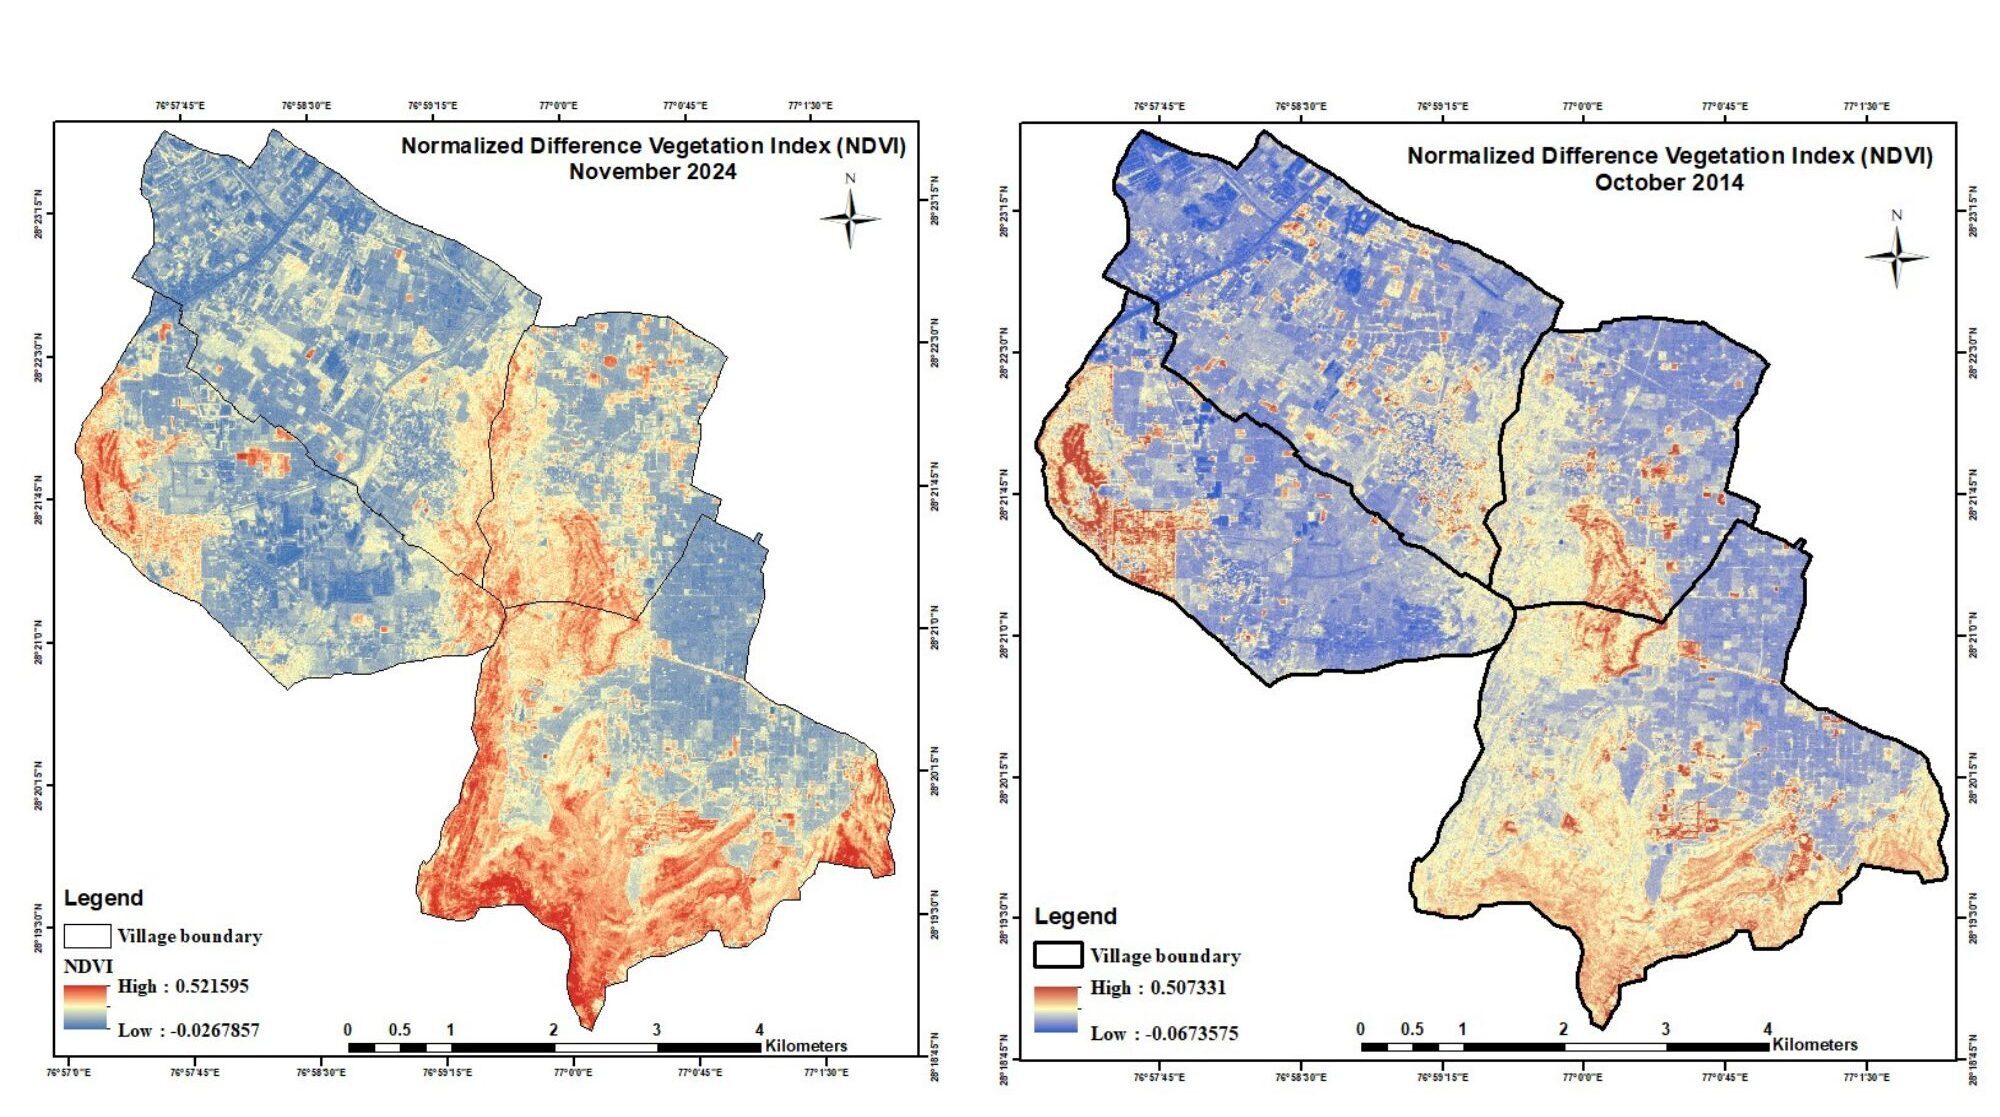
In the study area, mean NDVI ranges between 0.13 – 0.25, this indicates that the area has
widespread sparse or degraded vegetation, necessitating large-scale scientific interventions for eco-restoration.
Figure- NDVI map of the study area of 2014 and 2024.
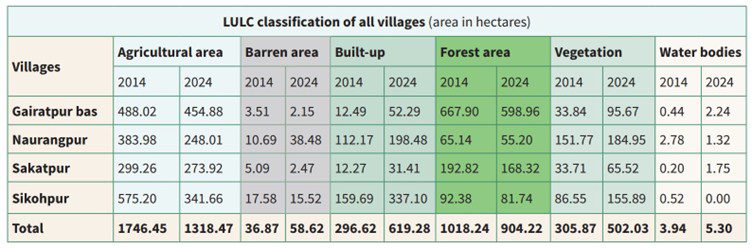
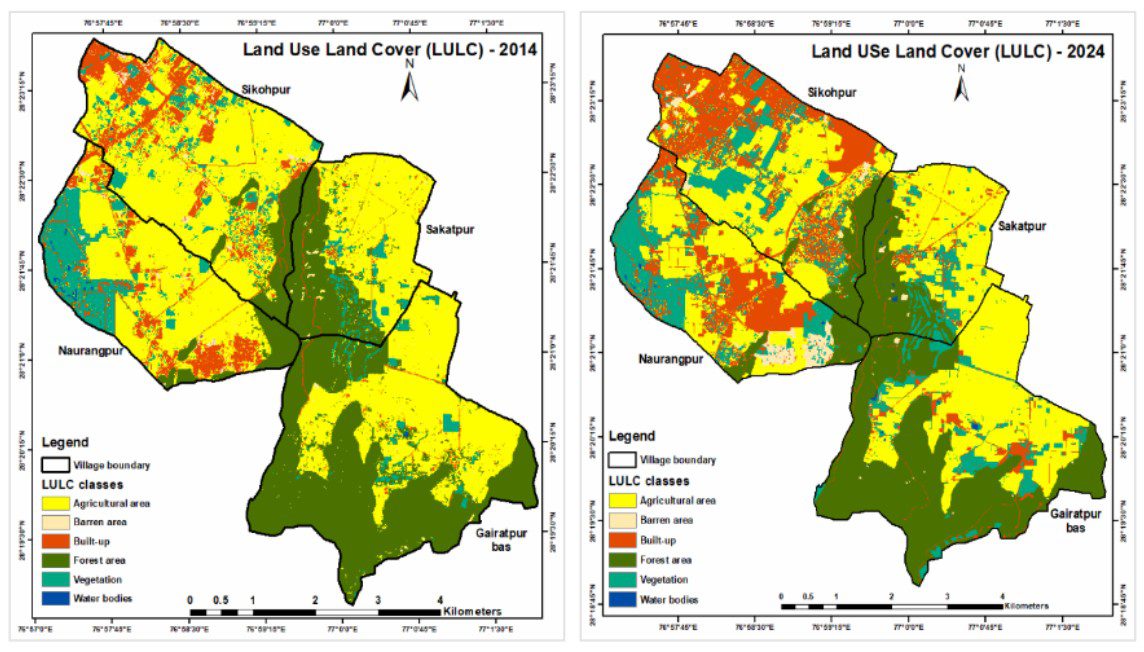
2. Land Use Land Cover (LULC)
Using LISS-IV satellite imagery for 2014 and 2024, the LULC change detection over the past decade
reveals a significant shift from agricultural to built-up areas, with agricultural land decreasing from
1749.4 to 1320.7 ha, most notably in Shikohpur and Naurangpur, while built-up areas nearly doubled
from 297.1 ha to 620.3 ha. Shikohpur alone saw an increase of 177.4 ha in built-up land. A total loss
of 114 ha of forest was recorded, with Gairatpur Bas witnessing the maximum decline due to
urbanisation.
Figure- Decadal changes (2014-2024) in the LULC of the study area.
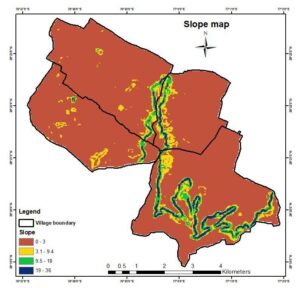
3. Slope
Slope determines soil stability, water retention, and vegetation suitability. Slope of the study area
ranges from 0° – 36°. Spatial slopes variations may be divided into classes i.e., gentle (0° – 3° ),
moderate (3.1° – 18°) and high (above 19°).
Figure- Slope map of the study area.
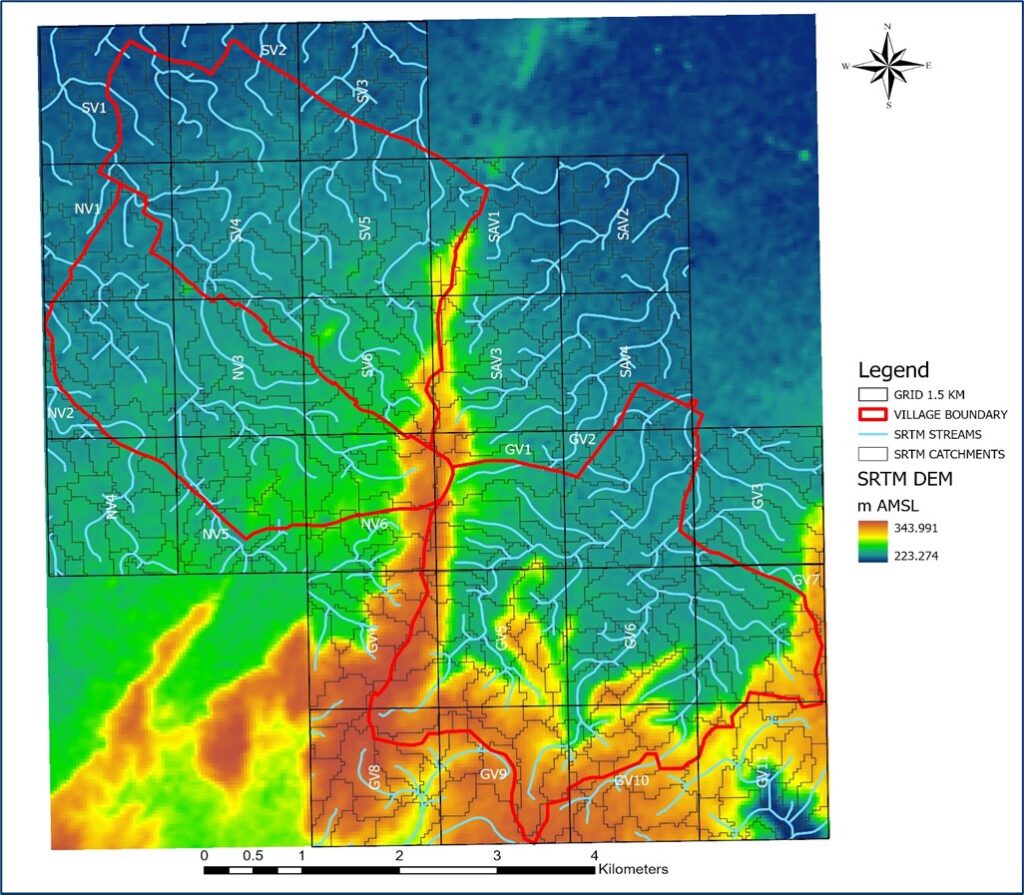
4. Digital Elevation Model (DEM) and Drainage Network
The map provides digital elevation models that can be analysed to delineate watershed and extract streams networks. It is helpful for understanding hydrological processes and managing water resources.
Figure- SRTM (Shuttle Radar Topography Mission) catchment and drainage map of the study area
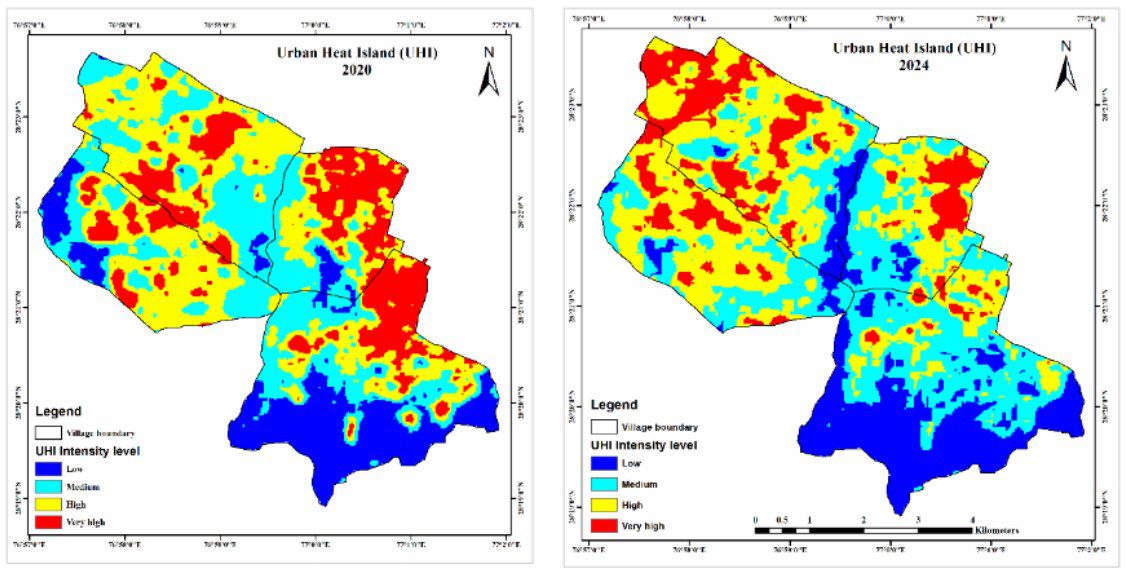
5. Land Surface Temperature (LST) and Urban Heat Island (UHI)
The analysis from 2020-2024 indicates significant surface temperature variation across the project area, ranging from 39.1°C in 2024 to a peak of 51.7°C in 2022, largely driven by LULC changes,
particularly the rapid expansion of built-up areas. Densely developed zones with limited vegetation
exhibit consistently higher LST, revealing the presence of UHI.
Figure- UHI map of the study area (2020 vs 2024)
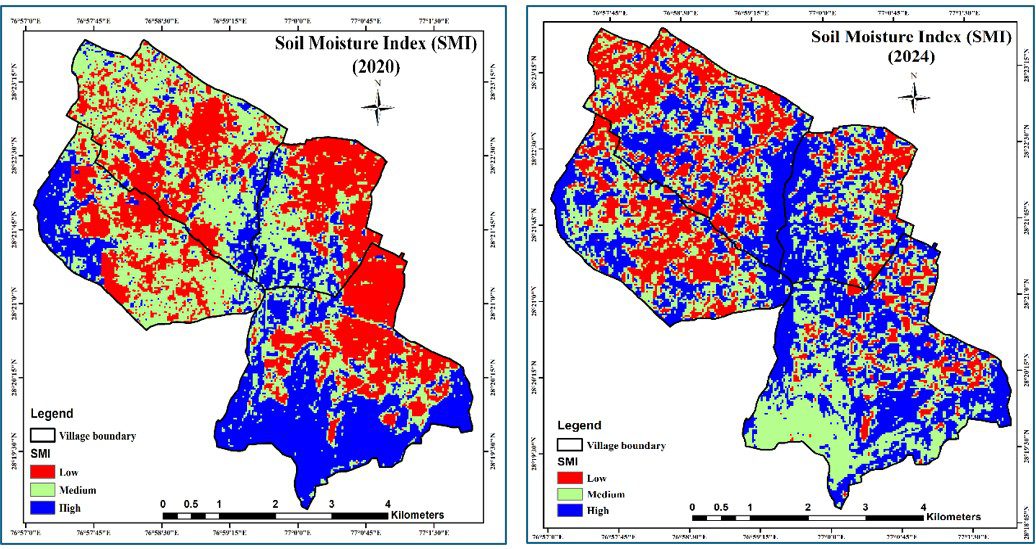
6. Normalised Difference Moisture Index (NDMI)
It indicates the soil moisture conditions. NDMI was derived from multi-temporal LANDSAT- 8, 9 imagery
for the years 2020 to 2024. This index effectively classifies the land surface into moisture zones, using
color-coded categories – dry zones (red), moderate zones (cream), and moist zones (blue).
Figure- NDMI map of the study area (2020 vs 2024)
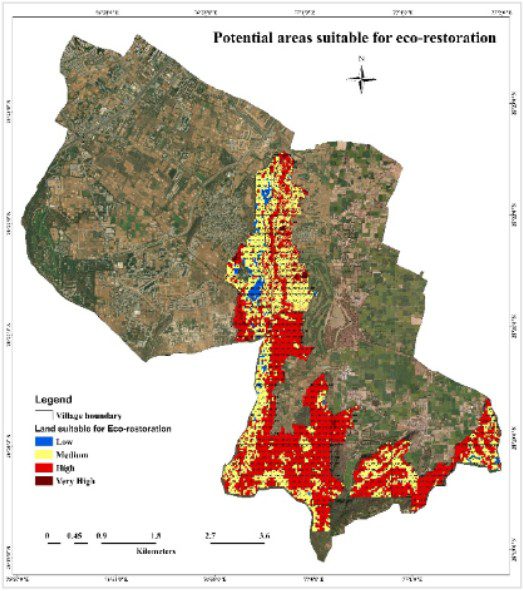
Integrating Layers for Smart Restoration
The real power lies in the integrated approach, combining two or more thematic data for identifying the area of interest:
NDVI + NDMI → vegetation health & water stress
LULC + Slope → suitable restoration techniques
DEM + Drainage → microwatershed planning
UHI + LULC → urbanecological buffer design
NDVI + NDMI + LULC + Slope + Drainage → Potential areas suitable for eco-restoration
This integrated geospatial framework supports nature based solutions (NbS) tailored to sitespecific conditions.
Figure- Indicative map of the study area showing the potential areas suitable for eco-restoration
The geospatial analysis of the Aravalli study area reveals a landscape under significant anthropogenic
pressure but still possessing ecological resilience. Spatial data integration shows critical degradation
hotspots, identifies potential eco-restoration zones, and offers actionable insights for planning
sustainable eco-restoration. To ensure the success of interventions, the eco- restoration strategy must
be landscape specific, science-driven, and community-inclusive, using geospatial findings as the
foundation for practical action.
Key Takeaways
Slope and elevation should be considered for the development of blue and green infrastructure.
Vegetation health to be improved through appropriate plantation of native species, as the area is devoid of dense vegetation.
LULC should be kept in mind for sustainable management of land resources and eco restoration activities should be planned accordingly.
LST in the built-up area can be decreased through proper plantation initiatives.
Soil moisture in the area can be managed by sustainable agricultural practices.
Dr Deepesh Goyal, Senior Research Associate is an environmental researcher with expertise in ecosystem recovery, sustainable development, and Nature-based Solutions (NbS). He earned his Ph.D. in Environmental Science from Guru Gobind Singh Indraprastha University, focusing on vegetation succession and soil recovery in Uttarakhand's landslide-affected areas.


")

